When we dive into data to understand how two things are related — say, hours of study and exam scores — two common tools often come up: correlation and regression. They may seem similar at first glance, and they do both deal with relationships between variables, but they serve very different purposes. In this post, we highlight the similarities and differences of the two tools and explore their individual use cases.
What Is Correlation?
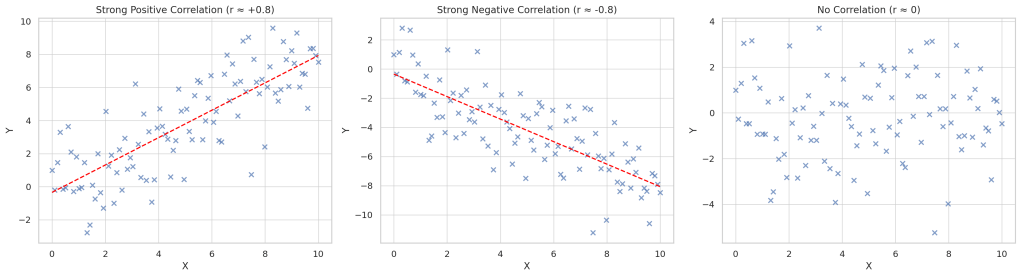
Correlation tells us if two variables are related — and if so, how strongly and in what direction. It gives us a single number, usually called r, that ranges from -1 to +1.
- A correlation of +1 means a perfect positive relationship — as one goes up, so does the other.
- A correlation of -1 means a perfect negative relationship — as one goes up, the other goes down.
- A correlation of 0 means no relationship at all.
So, if we find that hours studied and exam scores have a correlation of r = 0.80, we can say they are strongly and positively related — but that’s about it. Correlation doesn’t tell us how much exam score increases with each extra hour of study. It simply tells us that they tend to move together.
Read this post to find out more about how to run a correlation analysis.
What Is Regression?
Regression, on the other hand, takes things further. It doesn’t just tell us that two variables are related — it actually models that relationship in the form of an equation. Specifically, regression tries to predict one variable from another.
The most common form, linear regression, gives us a straight-line formula:
Y = b0 + b1X + e
Where:
- Y is the outcome (e.g., exam score),
- X is the predictor (e.g., hours studied),
- b0 is the intercept (value of Y when X is 0),
- b1 is the slope (how much Y changes with a one-unit change in X),
- e is the error term.
So, if you want to know how much exam scores improve with each hour of study, regression is your go-to tool. It provides estimates of that change (like “each hour of study is associated with a 5-point increase in exam score”).
Examples of regression plots.

High Estimate, Significant:
- The red line has a steep upward slope.
- This means that for every 1 unit increase in X, Y increases a lot (e.g., +2.5).
- Low variability (tight points around the line) → p-value is small, meaning the relationship is statistically significant.
Low Estimate, Significant:
- The red line is less steep.
- Y increases a little for each increase in X (e.g., +0.5).
- Still a tight pattern → p-value remains significant even though the slope is shallow.
Low Estimate, Non-Significant:
- The red line is flat-ish, but there’s a lot of scatter/noise.
- This high variability weakens confidence in the relationship → p-value is not significant.
Correlation vs Regression
At their core, both correlation and regression are about relationships between variables. They both tell us something about:
- Direction: Are the variables positively or negatively related?
- Strength: Is the relationship weak, moderate, or strong?
In fact, when you’re doing simple linear regression (with just one X and one Y), there’s a close mathematical link: the correlation coefficient r is related to the regression slope b1.
However, correlation and regression serves different purposes. This table is a break down of their differences.
| Feature | Correlation | Regression |
|---|
| Purpose | Measures strength & direction of relationship | Predicts one variable based on another |
| Formula Output | A single value r between -1 and +1 | A full equation: Y=b0+b1X + e |
| Directionality | No clear direction; it’s mutual | Directional — predicts Y from X |
| Use Case | Understanding relationships | Modeling & forecasting outcomes |
| Interpretation | “These two things move together” | “If X changes, Y will change by this much” |
One key thing: correlation doesn’t care which variable comes first — the relationship is symmetric. If studying and scores have a correlation of 0.80, the same holds true whether you predict scores from study time or vice versa.
But regression is directional — you’re explicitly saying X predicts Y, not the other way around.
Also, note that r is a standardized number (ranging from -1 to 1), while regression gives us unstandardized estimates. That means regression can tell us things like, “for every additional hour studied, your score increases by 5 points,” whereas correlation just says “they’re positively related.”
When to Use What?
So when should you use correlation, and when should you use regression?
- Use correlation when you want to explore relationships — you’re not trying to predict anything, just curious whether two things are related.
- Use regression when you’re interested in prediction or explanation — you want to know how one variable affects or explains another.
Final Thoughts
In short, correlation is about association, while regression is about prediction. Both are powerful tools, and they often go hand-in-hand in data analysis. But they’re used for different questions.
So next time you look at two variables and wonder if they’re connected, ask yourself: Do I just want to know if they move together, or do I want to predict one from the other? That’ll guide you to the right tool — correlation or regression.

Leave a comment