Category: Data Analysis
-
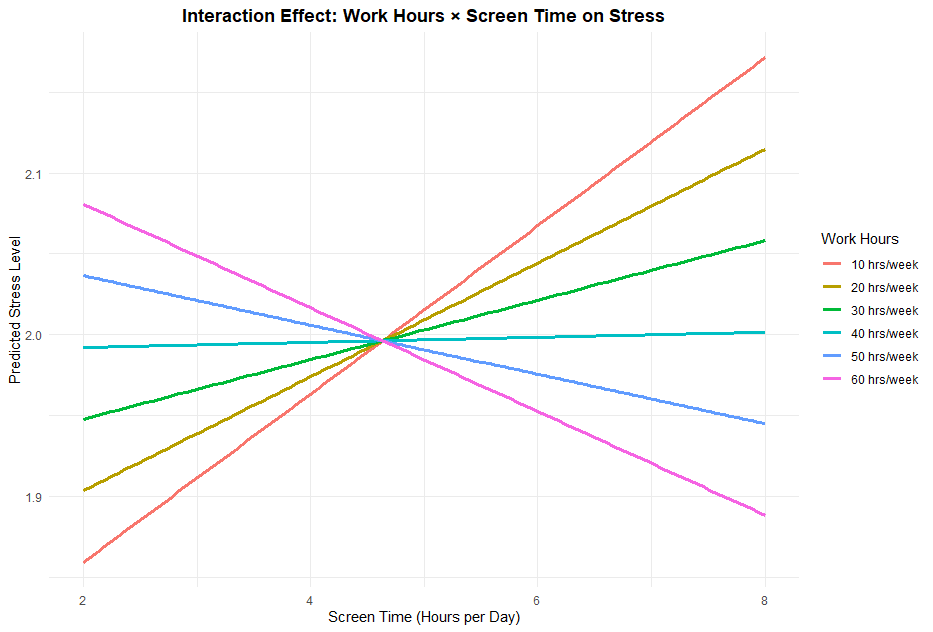
Why Interaction Effects Matter: A Case Study on Work, Screen Time, and Stress
When analyzing data to understand what drives stress levels, it’s tempting to focus only on individual predictors: how many hours we work, how much screen time we clock, or how many hours we sleep. But the real world is rarely that simple. Sometimes, two or more variables work together in unexpected ways. This is where…
-
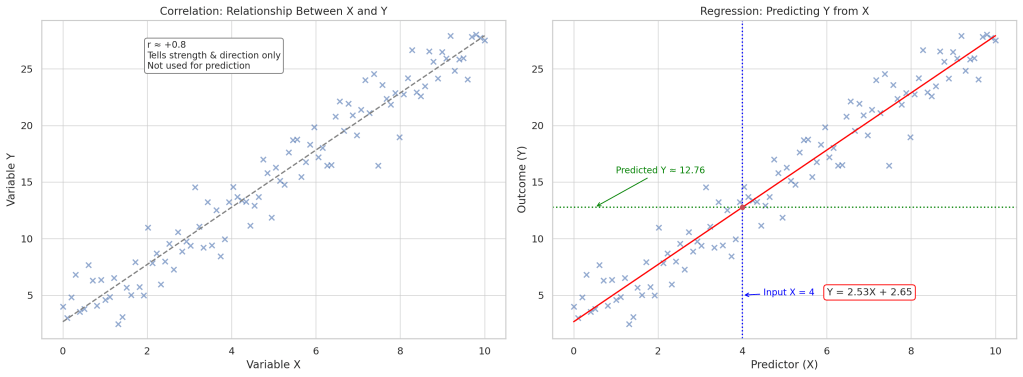
Correlation vs Regression: What’s the Difference?
When we dive into data to understand how two things are related — say, hours of study and exam scores — two common tools often come up: correlation and regression. They may seem similar at first glance, and they do both deal with relationships between variables, but they serve very different purposes. In this post,…
-
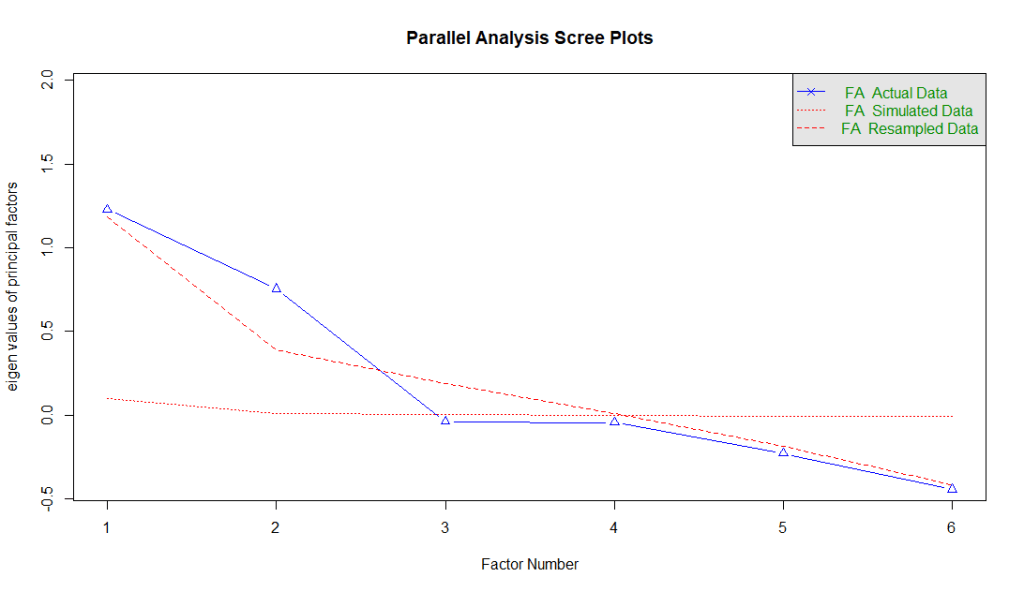
Construct Discovery using Exploratory Factor Analysis (EFA)
Say for example you have developed a brand new questionnaire that no one has used before. You designed it to measure an abstract construct, but you are unsure if the questionnaire is valid statistically. What would you do? This is where exploratory factor analysis (EFA) comes in. EFA is a statistical technique used when you…
-
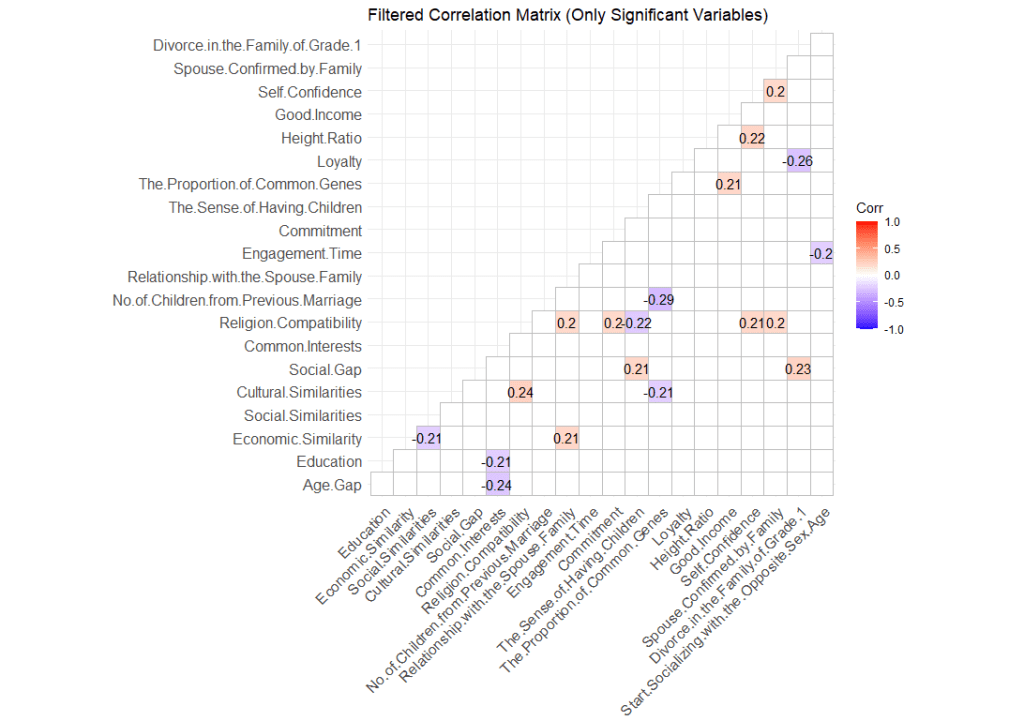
How to Create a Correlation Heatmap in R
A dataset isn’t just a spreadsheet of numbers — it’s a story waiting to be uncovered. As data analysts, our job is to make sense of that story by identifying patterns, relationships, and signals within the noise. But without a reference point, knowing where to begin can feel overwhelming. That’s where correlation analysis comes in.…
