Free speech remains one of the most hotly debated issues of our time — but not everyone defines it the same way. In this post, we analyze the 2018 General Social Survey (GSS) to explore how Americans think about who should be allowed to speak, especially when it comes to controversial or offensive groups.

To uncover deeper patterns beyond individual responses, we used Latent Class Analysis (LCA) — a statistical approach that groups people based on shared response profiles.
The MEasure
The measure we are using for this example are questions that relate to respondents’ acceptance of people who have certain views speaking. They are:
- SPKATH: There are always some people whose ideas are considered bad or dangerous by other people. For instance, somebody who is against all churches and religion… If such a person wanted to make a speech in your (city/town/community) against churches and religion, should he be allowed to speak, or not?
- SPKCOM: Suppose this admitted Communist wanted to make a speech in your community. Should he be allowed to speak, or not?
- SPKHOMO: Suppose this admitted homosexual wanted to make a speech in your community. Should he be allowed to speak, or not?
- SPKMIL: Consider a person who advocates doing away with elections and letting the military run the country. If such a person wanted to make a speech in your community, should he be allowed to speak, or not?
- SPKMSLM: Consider a Muslim clergyman who preaches hatred of the United States. If such a person wanted to make a speech in your community preaching hatred of the United States, should he be allowed to speak, or not?
- SPKRAC: Consider a person who believes that Blacks are genetically inferior. If such a person wanted to make a speech in your community claiming that Blacks are inferior, should he be allowed to speak, or not?
Responses that hints at ambiguity are coded as invalid and given the code 999. “Allowed” is coded as 0, and “not allowed” is coded as 1. This means that lower values reflect greater tolerance.
Latent Class Analysis (LCA)
We chose LCA because we were interested not just in how people responded to individual questions, but in whether there were distinct patterns or subgroups among respondents. Do some consistently defend free speech? Are others more selective? Are there groups that reject most controversial speech?
In short, LCA allows us to:
- Detect unobserved (latent) subgroups
- Describe each group’s response pattern
- Use statistical model fit indices to select the best number of profiles
There is no one-size-fit-all script that we can run to tell us the best solution for the data. Rather, we will need to run the model class by class. Starting from the 2-class solution model, then work our way up. For example, we will have one script for the 2-class solution, one script for 3-class solution, one script for 4-class solution, and so on.
What I prefer to do is to compile them into an excel summary sheet. This will allow me to have an overview of the work I have done and to monitor the relelvant statistics to determine where should we stop.
Determining Optimal Class Solution
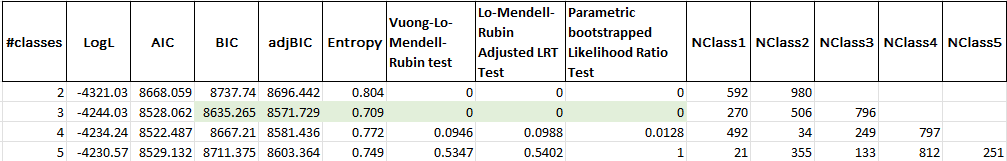
As a rule of thumb, I normally examine several statistics in order to determine the optimal class solution. They are the Bayesian Information Criterion (BIC), Entropy, and Vuong-Lo-Mendell-Rubin (VLMR), and Lo-Mendell-Rubin Adjusted LRT (LMR).
BIC and AdjBIC finds the balance between goodness of fit and parsimony (simplcity — avoiding too many classes). To determine best fit, look for the lowest BIC and AdjBIC value.
Entropy tells us how accurately individuals are assigned to each class based on their posterior probabilities. To put it simply, posterior probabilities refer to the probability that an individual belongs to each latent class based on their observed data. Therefore, the entropy is a summary measure of these probabilities across all individuals. Entropy ranges from 0 to 1. But as a rule of thumb, entropy value that ranges between 0.8 to 0.9 are considered high certainty and a good model.
| Entropy Value | Interpretation |
|---|
| ≈ 1.0 | Very high classification certainty (perfect separation) |
| 0.8–0.9 | High certainty, good model |
| 0.6–0.8 | Moderate certainty |
| < 0.6 | Poor classification (lots of uncertainty) |
Finally, the VLMR and LMR are likelihood-based model comparison tests that examines what quantity of latent class that best fit the data. It tests whether a model with k-classes is better than k-1 classes (e.g. is the 3-class solution better than the 2-class solution?). If the values are significant, then we know that k-class is significantly better than k-1 class. If it is not significant, then the simpler model is better.
Hence, when we examine the VLMR and LMR, we look for insignificant p-values. If there is an insignificant value for k-class, then we know that k-1 class is better.
MPlus Script
The analysis is done using MPlus v8.11. As a note, data imported into MPlus should not contain headers. Hence, please be sure to delete the header row. MPlus will use the “VARIABLE” function to map the variable to their appropriate columns for analysis.
Below is a 3-class LCA script as a reference.
  TITLE: gss_speak_3-class

  DATA: FILE IS "speak_lpa.csv";

  VARIABLE: Names are SPKATH SPKCOM SPKHOMO
                      SPKMIL SPKMSLM SPKRAC;
      CATEGORICAL = SPKATH SPKCOM SPKHOMO SPKMIL SPKMSLM SPKRAC;
      MISSING = ALL (999);
      USEVAR = SPKATH SPKCOM SPKHOMO
               SPKMIL SPKMSLM SPKRAC;
      CLASSES = L(3);

  ANALYSIS:
    TYPE = MIXTURE;
    STARTS = 1000 250;
    STITERATIONS = 20;
    LRTSTARTS = 0 0 100 20;
    ESTIMATOR = MLR;

  OUTPUT:
    SAMPSTAT TECH1 TECH4 TECH8 TECH10 TECH11 TECH14;

  PLOT:
      TYPE = Plot3;
      SERIES =
          SPKATH (1)
          SPKCOM (2)
          SPKHOMO (3)
          SPKMIL (4)
          SPKMSLM (5)
          SPKRAC (6);

  SAVEDATA:
      File is gss_speak_3-class.csv;
      SAVE IS cprobabilities;
The Results
When we compiled the data, we found that the 3-class solution best fit the data based on the BIC, AdjBIC, Entropy, VLMR, and LMR. The 3-class solution has the lowest BIC, AdjBIC, and Entropy results. The VLMR and LMR for the 4-class solution also returned us insigifcant results. Hence, we can safely say that the best fitting model is the 3-class solution.
The Best Fitting Solution
Once we have identified the best fitting solution for the data, we need to zoom into the individual model results of the best fitting solution. In this case, we examine the model results of the 3-class solution.
Because we coded the values to be 0 = Allowed and 1 = Not allowed, lower values now represent allowed and higher values represent now allowed. The interpretation of the values are shown in tabular form below.
| Logit | Probability | Interpretation |
|---|---|---|
| < -2 | < 0.12 | Very low probability (almost always 0 = “allowed”) |
| -1.5 | ~0.18 | Mostly “allowed” |
| -1 | ~0.27 | Tends toward “allowed” |
| 0 | 0.50 | 50/50 split |
| 1 | ~0.73 | Tends toward “not allowed” |
| 1.5 | ~0.82 | Mostly “not allowed” |
| 2 | ~0.88 | Strong “not allowed” |
| 3+ | > 0.95 | Very strong “not allowed” |
| 5+ | > 0.99 | Near-certain “not allowed” |
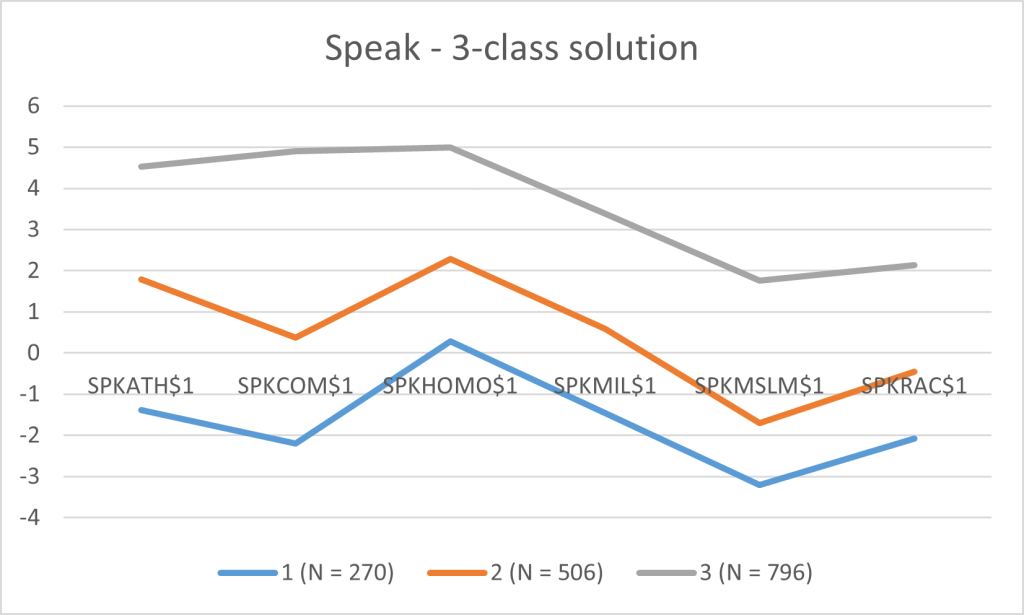
Using this we will be able to interpret our data. I exported the data from model results, extracted the estimates, and pivoted into wide form. Below is the resulting data.
| Latent Class | SPKATH$1 | SPKCOM$1 | SPKHOMO$1 | SPKMIL$1 | SPKMSLM$1 | SPKRAC$1 |
| 1 (N = 270) | -1.385 | -2.191 | 0.289 | -1.465 | -3.212 | -2.082 |
| 2 (N = 506) | 1.795 | 0.374 | 2.28 | 0.578 | -1.695 | -0.451 |
| 3 (N = 796) | 4.532 | 4.901 | 4.989 | 3.379 | 1.766 | 2.138 |
Interpretation
In order to interpret the values, we need to convert the logit estimates to probabilities. We do this using this formula.

Alternatively, we are able to add “tech10” into the MPlus output script to get the probability values. Using this, we can interpret the results.
Latent Class 1 (N = 270)
| Item | % Say “Not Allowed” | Interpretation |
|---|
| SPKATH | 80% | 80% would not allow anti-atheist speech |
| SPKCOM | 89.9% | Strongly not allowed for communists |
| SPKHOMO | 42.8% | Mixed, leaning toward allowed |
| SPKMIL | 81.2% | Not okay to speak against the military |
| SPKMSLM | 96.1% | Overwhelmingly not allowed for Muslims |
| SPKRAC | 88.9% | Strongly against racist speech |
Latent class 1 is strongly protective, especially of minority or sensitive groups. Most members do not allow controversial speech, especially against Muslims and racial groups. They’re relatively more ambivalent about homosexuality.
Latent Class 2 (N = 506)
| Item | % Say “Not Allowed” | Interpretation |
|---|
| SPKATH | 14.3% | Mostly allowed anti-atheist speech |
| SPKCOM | 40.8% | Mixed views |
| SPKHOMO | 9.3% | Mostly allowed |
| SPKMIL | 35.9% | Mixed views |
| SPKMSLM | 84.5% | Strongly not allowed |
| SPKRAC | 61.1% | More than half would not allow racist speech |
Latent class 2 is somewhat protective, especially toward Muslims and race. But they’re more accepting of speech against atheists and homosexuals. They represent a moderate or selectively tolerant group.
Latent Class 3 (N = 796)
| Item | % Say “Not Allowed” | Interpretation |
|---|---|---|
| SPKATH | 1.1% | Overwhelmingly allowed |
| SPKCOM | 0.7% | Allowed |
| SPKHOMO | 0.7% | Allowed |
| SPKMIL | 3.3% | Allowed |
| SPKMSLM | 14.6% | Mostly allowed |
| SPKRAC | 10.6% | Mostly allowed |
Latent Class 3 is highly tolerant of speech, even controversial or offensive speech. They most strongly represent a free-speech absolutist group — very few restrictions across the board.
Concluding Thoughts
This analysis is based on data from the 2018 General Social Survey (GSS), one of the most respected and long-running sociological surveys in the United States. Conducted by the National Opinion Research Center (NORC) at the University of Chicago, the GSS captures a representative cross-section of American adults, offering valuable insights into societal attitudes, including views on free speech and civil liberties.
Using Latent Class Analysis (LCA), we uncovered three distinct profiles of Americans based on their tolerance for controversial speech: (1) those who are broadly restrictive, particularly toward speech targeting marginalized groups; (2) a moderate group with selective boundaries around what should be allowed; and (3) a group of free speech absolutists who are permissive of nearly all forms of expression.
But beyond the findings themselves, this exercise highlights the power of LCA as a statistical tool. Rather than treating the population as uniform or splitting respondents along arbitrary thresholds, LCA allows us to identify underlying, unobserved subgroups based on response patterns. For students, social science researchers, or data enthusiasts, it’s a reminder that classification is not always obvious—and that the data itself can reveal hidden structures when approached thoughtfully. Whether you’re working with attitudes, behaviors, or preferences, LCA can uncover nuance that simpler analyses might miss.
Additional Resources:
Feel free to download my LCA summary workbook for reference.

Leave a comment