When analyzing data to understand what drives stress levels, it’s tempting to focus only on individual predictors: how many hours we work, how much screen time we clock, or how many hours we sleep. But the real world is rarely that simple. Sometimes, two or more variables work together in unexpected ways. This is where interaction effects come into play.
In this post, we’ll walk through how interaction effects can reveal deeper insights, using a real-world dataset: the Mental Health and Lifestyle Habits dataset available on Kaggle (Soundankar, 2024). Specifically, we’ll explore whether working hours, screen time, and sleep duration predict stress, and how including interaction terms helps us uncover relationships we would otherwise miss.
Dataset Overview The dataset used is titled Mental Health and Lifestyle Habits (2019-2024), compiled by Atharva Soundankar and available on Kaggle.
It contains self-reported data on over 3,000 individuals, including their mental health conditions, lifestyle habits, stress levels, and more.
In this example, we explore the question whether working hours, screen time, and sleep duration predict an individual’s level of stress? And more importantly, we explore whether the effect of one variable depend on another?
Data Preparation
To begin, I prepare the data by loading it into R and examining its correlation.
I recoded the stress level data from textual form to numerical form for analysis.
library(dplyr)
mentalhealth$Stress.Level_R <- recode(mentalhealth$Stress.Level,
                                    "Low" = 1,
                                    "Moderate" = 2,
                                    "High" = 3)
Next, I build the preliminary model using simple linear regression.
org_model <- lm (Stress.Level_R ~ Work.Hours.per.Week + Screen.Time.per.Day..Hours. + Sleep.Hours, data = mentalhealth)
summary(org_model)
This model examines the main effects of each variable. However, it assumes that these predictors are independent — that screen time impacts stress the same way regardless of how many hours a person works. My results are as follows:

Based on this results, we see that none of the variable in question significantly predict stress level. This is not unexpected because we know that in real life, different variables tend to interact with each other. That is why we will need to include an interaction term in our model. But what interactions should we include? To decide on which interaction to include, we examine our options and determine it using logic. The possible permutations of interactions are as follows.
- Work hours x Screen Time
- Work hours x Sleep Hours
- Screen time x Sleep hours
Work hours x Screen Time. We figure that if someone work long hours, people might want to take a break from staring at the screen time (to decrease stress). But if someone doesn’t work much, high screen time might be associated with other factors that causes stress. So there is a possible interaction here.
Work hours x Sleep hours. Working long hours might cause people to sleep well and in return, manage stress better. However, stress might spike if someone works a lot and have a lack of sleep. So it goes both ways. Hence, we conclude that there is also a possible interaction.
Screen time x Sleep hours. Is there a possibility that the screen time is associated with sleep hours? There is a possibility where screen time cuts into sleep time. Or people who sleep more have lower screen time. The theoretical connection between these variables seem weaker and hence we conclude that there isn’t a possible interaction here.
Generate Interaction Terms
Interaction terms is generated by multiplying the relevant variables together. In this context, we will generate two interaction terms. Work hours x Screen time, and Work hours x sleep hours.
mentalhealth$work_screen <- mentalhealth$Work.Hours.per.Week * mentalhealth$Screen.Time.per.Day..Hours.
mentalhealth$work_sleep <- mentalhealth$Work.Hours.per.Week * mentalhealth$Sleep.Hours
Using this newly generated interaction term, we generate the new regression model.
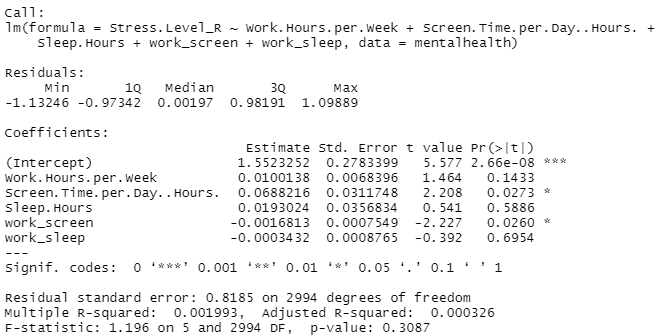
model <- lm (Stress.Level_R ~ Work.Hours.per.Week + Screen.Time.per.Day..Hours. + Sleep.Hours + work_screen + work_sleep,
             data = mentalhealth)
summary(model)
In the results, we see that two items significantly predict stress level. (1) Screen time per day positively predict stress, and (2) the interaction between work and screen time negatively and significantly predict stress.
Interpretation
Based on the results, we know that screen time increases with stress. More specifically, for ever 1 additional hour of screen time per day, stress level significantly increases by approximately 0.07 units on average. Next, the significant relationship between the interaction term work_screen and stress shows that the more hours someone work, the less screen time will affect their stress. In other words,
- For someone with low work hours, screen time increases stress a lot.
- For someone with high work hours, screen time has less impact on stress.
This tells us that more screen time is linked to higher stress — but only for people who work fewer hours. For people who already work a lot, screen time doesn’t have much additional impact on their stress levels.
Why Interaction Matter
The results tell us that screen time increases stress only for people with fewer work hours. For individuals working long hours, screen time doesn’t make a big difference. This insight would be missed if we only looked at the main effects. If we exclude interaction terms, we assume that the effect of screen time (or sleep) on stress is constant across all levels of work. In reality, our results show that this isn’t true. Interactions tell us about conditional relationships. These are the kinds of insights that matter in real life. They reflect the complexity of human behavior — and help us build better, more personalized interventions.
Visualising the Interaction
To help us visualise the interaction, we can plot a line graph where y-axis reflects the predicted stress level, and x-axis reflects the screen time. Based on the regression model, we can manually input our work hours and examine how work hours predict stress level. In this example, I’m going to use a range of working hours from 10h/week to 60h/week. I’m also keeping sleep hours as a constant by using the average value across all scenarios.
work_levels <- c(10, 20, 30, 40, 50, 60)
sleep_avg <- mean(mentalhealth$Sleep.Hours, na.rm = TRUE)
Next, I used this code to plot the graph to visualise my interaction effect.
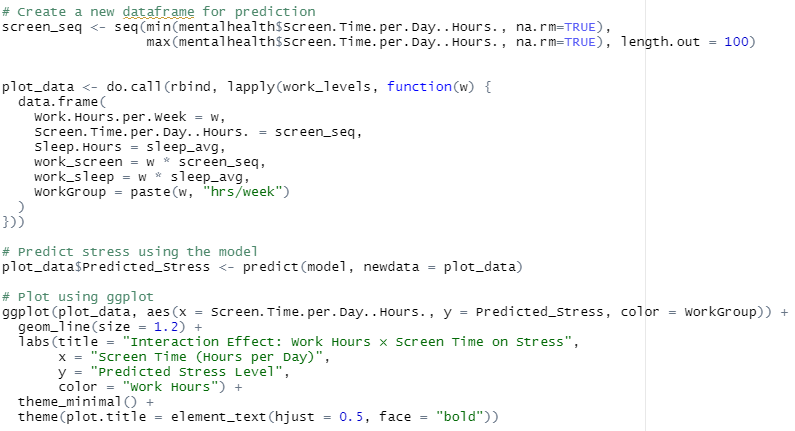
The resulting line graph is as follows:
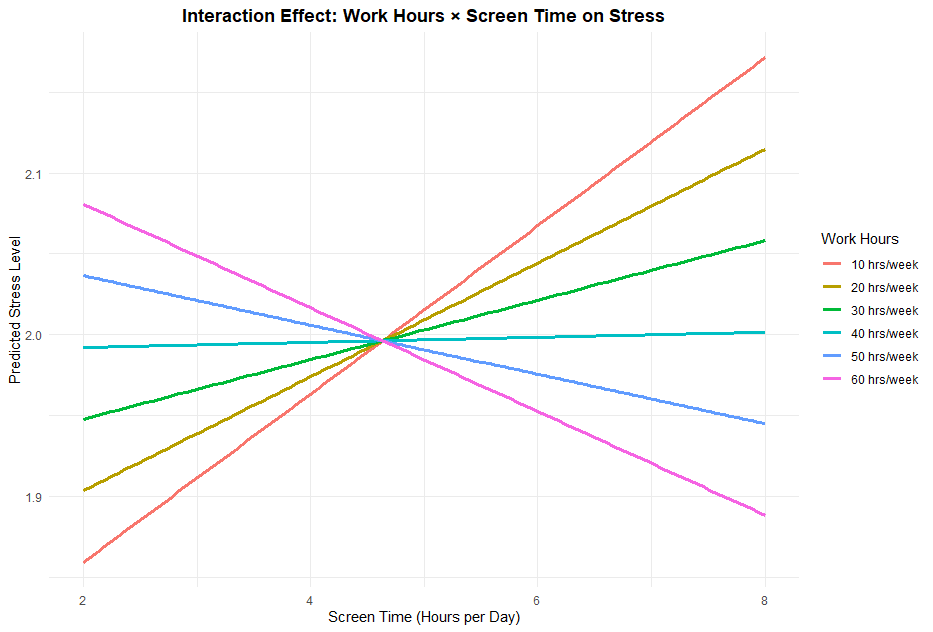
Recall how our model is Stress.Level_R ~ Work.Hours.per.Week + Screen.Time.per.Day..Hours. + Sleep.Hours + work_screen + work_sleep. Therefore, we see that the effect of screen time is dependent on work hours. More specifically, the slope (the steepness of the line) changes with work hours.
| Work Hours | Line Slope (Screen Time → Stress) | Why the line is where it is |
|---|---|---|
| Few (i.e. 10-20 hours) | The line slopes upward → More screen time → more stress | Screen time increases stress. |
| Moderate (i.e. 40 hours) | The line is almost flat → Screen time has little to no impact on stress | Minimal interaction effect. |
| High (i.e. (50 or 60 hours) | The line slopes downward → More screen time → less stress | Strong negative interaction — Screen time reduces stress |
This is happening because our interaction term is negative:
Stress_Level = β₁(Screen_Time) + β₂(Work_Hours) + β₃(Screen_Time × Work_Hours) + β4(Sleep × Work_Hours)
This negative interaction coefficient indicates that the impact of screen time on stress isn’t universal—it depends on how much a person works. For those working fewer hours, screen time tends to elevate stress levels, possibly due to excessive leisure or digital overstimulation. In contrast, for those clocking longer work hours, screen time may serve as a form of recovery or escape, actually lowering their perceived stress. By modeling this interaction, we avoid misleading conclusions and better capture the nuanced ways lifestyle factors influence mental health.
Final Thoughts
This analysis demonstrates the importance of including interaction effects in regression modeling. By examining how working hours modify the effects of screen time and sleep, we uncovered patterns that would be invisible in a simpler model.
Next time you’re running a regression, pause and ask: Could these variables be interacting? It might change your understanding entirely.
Soundankar, A. (2024). Mental health and lifestyle habits (2019-2024) [Data set]. Kaggle. https://www.kaggle.com/datasets/atharvasoundankar/mental-health-and-lifestyle-habits-2019-2024

Leave a reply to Devendr Cancel reply